
Balance de carbono del olivar: lo que secuestra y lo que emite cada parcela
Tu olivar secuestra carbono y también emite CO₂. En la mayoría de las parcelas piloto, el olivar guarda más de lo que emite. El Grupo Operativo Olive Carbon Balance, coordinado por Ecovalia, ya calcula este balance en sus fincas piloto, parcela a parcela. Y separa la parte que más depende de ti.
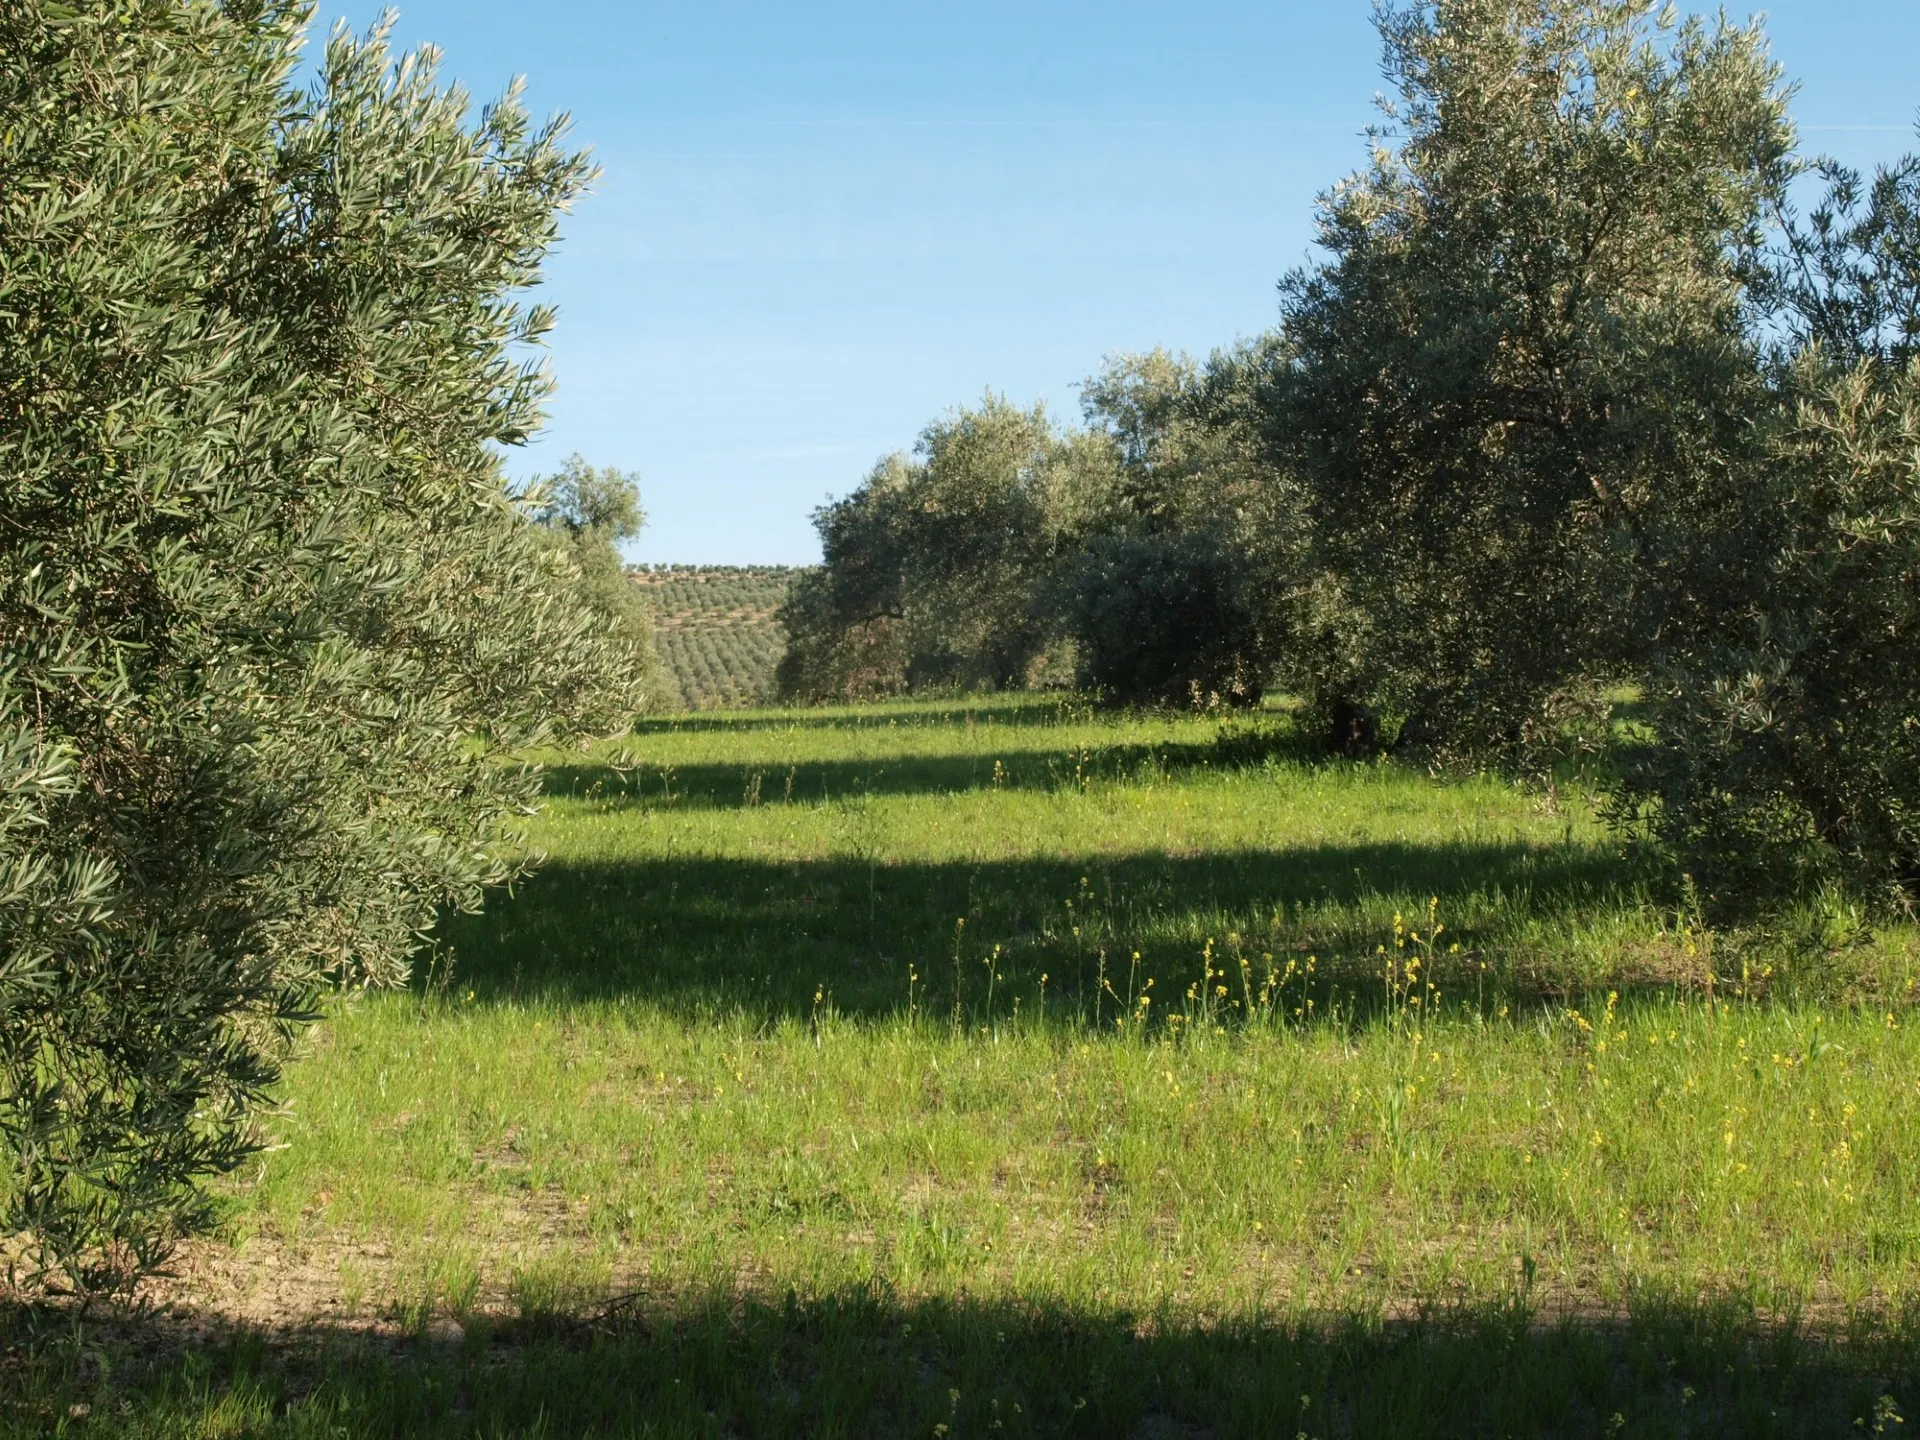
Dos cifras por parcela: lo que guarda tu olivar y lo que emite
Piensa en tu olivar. Todos los años acumula carbono en dos sitios: en el árbol y, puede que también, en el suelo. Cada olivo acumula carbono en su madera, año tras año, y eso lo tienes asegurado. La cubierta vegetal aporta carbono orgánico al suelo. También lo aportan los restos de poda que dejas triturados en tu finca, la hoja del olivo que cae bajo el árbol, los exudados de la raíz y el abono orgánico que echas, como el estiércol. Pero el suelo también pierde cada año una parte del carbono orgánico que tiene, sobre todo porque se descompone y vuelve a la atmósfera, y también por la erosión. Que el suelo gane carbono cada año no está asegurado: depende de cómo lo manejes. Y ese manejo emite CO₂ a la atmósfera con el gasóleo, con la energía del riego si no es renovable y con el abono nitrogenado, mineral u orgánico. Cuánto se emite depende mucho del manejo.
La herramienta de Olive Carbon Balance pone todo eso en la misma cuenta y da dos cifras en cada una de las fincas de estudio, en kilos de CO₂ por hectárea y año. La primera es el balance: la suma de lo que cada año se almacena en la madera del olivo y del cambio neto del carbono orgánico del suelo, menos el CO₂ que se emite, sobre todo con el combustible y la energía no renovable que usas. La segunda cifra te la explicamos más abajo.
Las dos cifras son estimaciones hechas con datos reales de las fincas experimentales de Olive Carbon Balance, procesados con modelos. Muestran el balance de carbono, pero no deben confundirse con los créditos de carbono. En la investigación participan la Universidad de Jaén, con su Instituto Universitario de Investigación en Olivar y Aceites de Oliva (INUO), la Asociación Española de Municipios del Olivo (AEMO) y tres centros del Consejo Superior de Investigaciones Científicas (CSIC). Son el Instituto de Agricultura Sostenible (IAS-CSIC), el Centro de Edafología y Biología Aplicada del Segura (CEBAS-CSIC) y el Centro de Automática y Robótica (CAR-CSIC). La herramienta es parte de un proyecto de investigación: hoy los cálculos se basan en las fincas piloto, con los datos de los socios, pero el equipo sigue afinando la herramienta.

Una parte del nitrógeno del abono sale al aire como óxido nitroso, un gas que calienta cientos de veces más que el CO₂. La herramienta lo pasa a los kilos de CO₂ que calentarían lo mismo.
Un balance positivo quiere decir que se guarda más de lo que sale al aire. También puede salir negativo. La cuenta todavía no incluye todo lo que pasa en la finca: más abajo verás qué falta.
La hierba, la poda, el gasóleo y el abono: la parte que más depende de ti
Al lado del balance, la herramienta enseña siempre una segunda cifra: la cubierta y los restos de poda menos las emisiones. Es la parte que más depende de lo que decides cada año: la hierba que dejas crecer en las calles, los restos de poda que trituras y dejas en la parcela, y el gasóleo, la luz y el abono que usas. También influye la lluvia de septiembre a mayo. Esta cifra solo junta la cubierta, la poda y las emisiones. Deja fuera la madera del olivo, la respiración del suelo, la hoja caída y el carbono del abono orgánico. El nitrógeno de ese abono sí cuenta, porque va en las emisiones. Por eso, si abonas con estiércol, esta cifra baja, aunque su carbono sí suma en el balance.
La madera queda fuera a propósito. El modelo de la Universidad de Jaén la calcula con la edad del olivar y los olivos por hectárea, sin medir los árboles. Da una media por año de vida: lo que el árbol ha guardado en toda su vida, repartido entre sus años. Por eso refleja sobre todo la edad y la densidad, más que lo que has hecho este año.
Como sabes, el riego, la poda y el abonado cambian la forma en que crece un olivo, y separar ese efecto pide más años de medidas. En un olivar adulto que se poda con regularidad, lo que crece en un año concreto puede quedar por debajo de esa media.
La segunda cifra puede salir negativa, cuando las emisiones superan lo que aportan la cubierta y la poda. La herramienta la enseña igual, con el detalle de cada parte.
Casi todos los datos ya están en el cuaderno de campo
Para calcular el balance de una parcela, la herramienta pide la edad del olivar, el número de olivos por hectárea y el tipo de olivar: tradicional, intensivo u olivar en seto. Pide también la lluvia de septiembre a mayo y el estado de la cubierta. Para las emisiones pide los litros de gasóleo y de gasolina por hectárea de todas las labores y los kilos de nitrógeno que aportas con el abono, sea mineral u orgánico, como el estiércol o el alperujo. Si es un olivar de riego, pide los kilovatios hora por hectárea que gasta el riego al año, si la energía no es renovable. Si echas abono orgánico, pide también qué producto es y cuántos kilos echas por hectárea y año, para calcular el carbono que deja en el suelo. El nitrógeno que dejan en el suelo los restos de poda, la hierba y la hoja del olivo no hace falta que lo calcules: sale de las estimaciones de los socios.
Casi todo está ya en los papeles que tienes: el cuaderno de explotación, el registro de explotaciones, las facturas del gasóleo y de la luz y la estación meteorológica más cercana. Si te lleva el cuaderno alguien de la cooperativa, ya tienes casi todos estos datos. A veces el gasóleo y la luz se anotan para toda la finca y hay que repartirlos por hectárea.
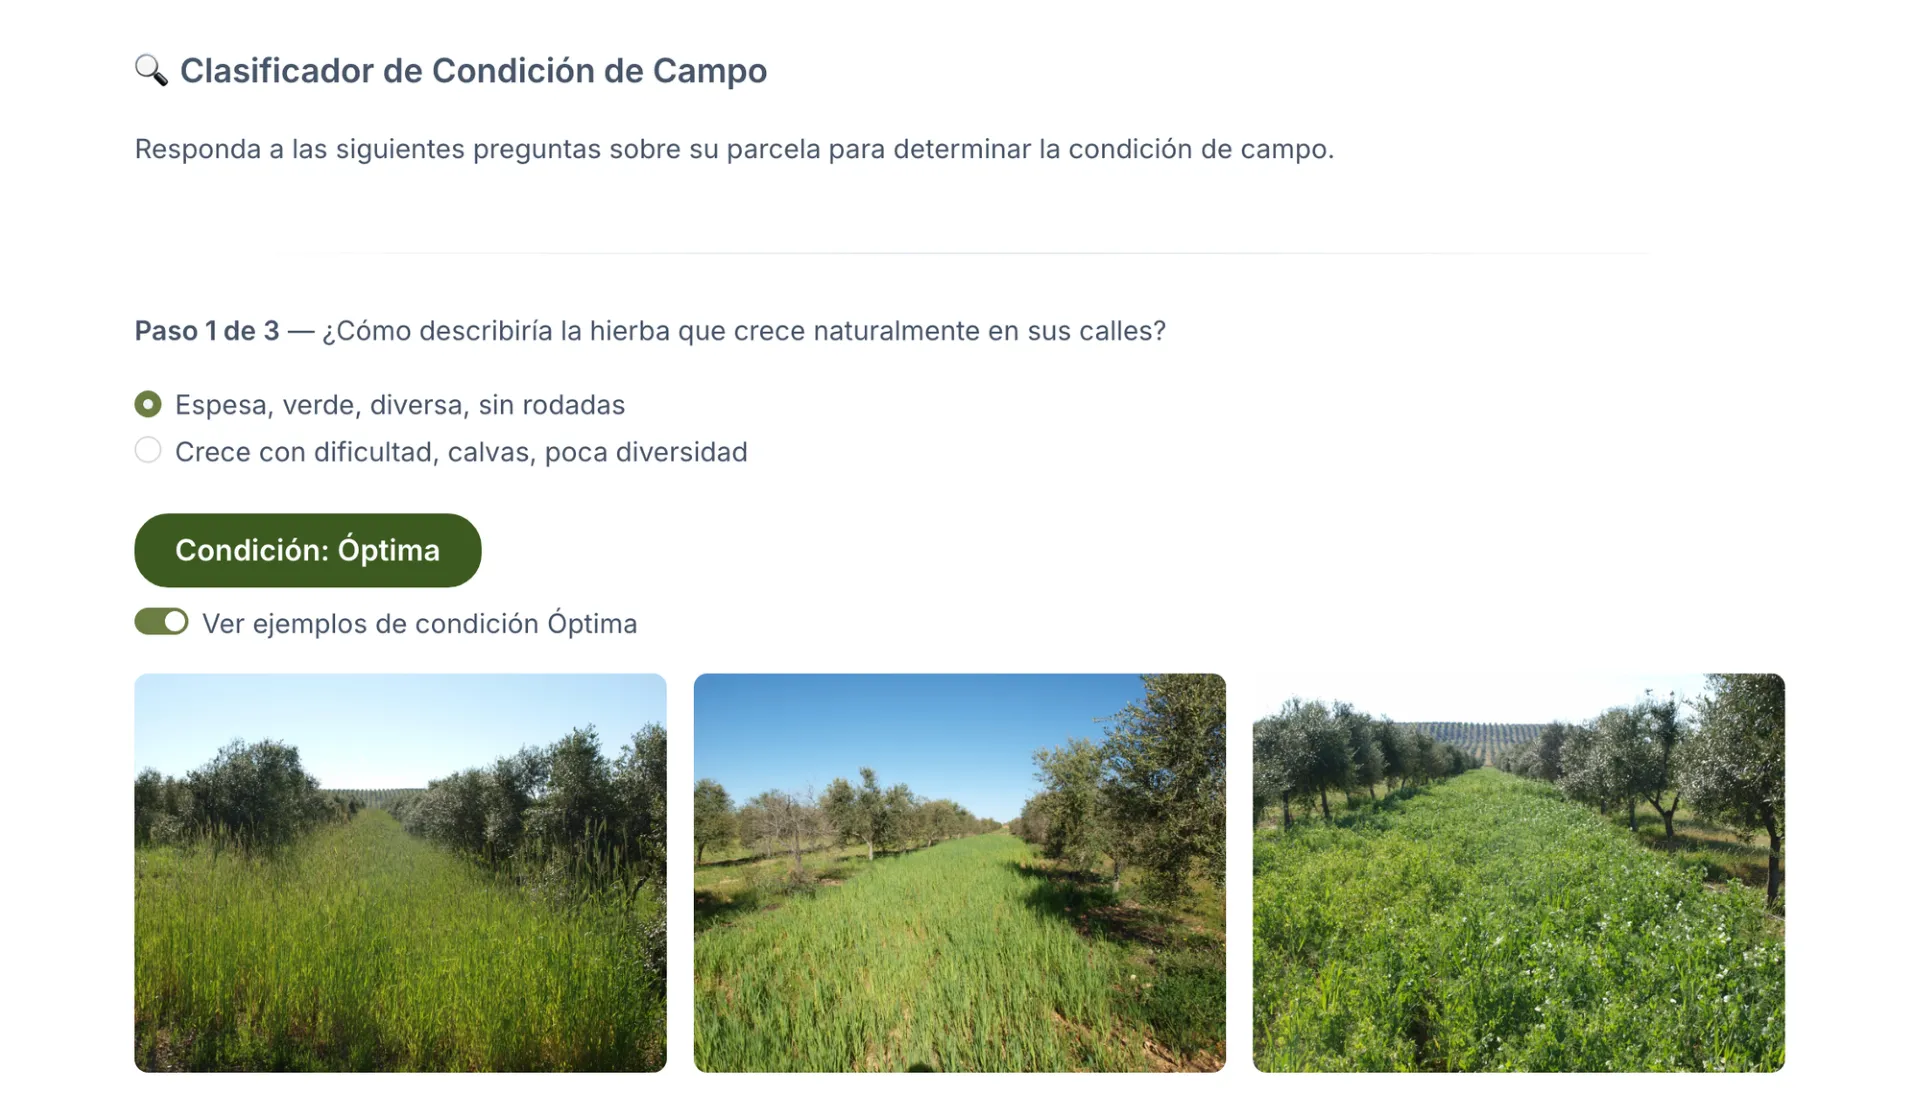
Para saber cuánto carbono entra con la cubierta basta con echarle un vistazo. La herramienta te hace hasta tres preguntas, con fotos de ejemplo del IAS-CSIC. Si cobras el ecorrégimen de cubiertas en leñosos, es la misma cubierta que ya mantienes, aunque la herramienta va aparte de ese trámite de la PAC.
Entre 1,1 y 6,4 toneladas de CO₂: lo que almacena de media la madera del olivo cada año
Según los primeros resultados del Grupo Operativo Olive Carbon Balance, publicados en diciembre de 2025, la madera del olivo almacena de media entre 1,1 y 6,4 toneladas de CO₂ por hectárea y año de vida del árbol, según el tipo de olivar. Son valores provisionales, medidos por la Universidad de Jaén y AEMO en las parcelas piloto, con mucha variación entre parcelas.
Los olivares tradicionales de la red de fincas de Olive Carbon Balance almacenan de media 1,2 toneladas de CO₂, casi lo mismo que los intensivos, 1,1. Los olivares en seto de la red, de entre 800 y 1200 olivos por hectárea, almacenan de media 6,4 toneladas al año, y los de más de 1200 olivos, 2,2.

Cada media sale de solo tres a cinco parcelas, y la del seto de más de 1200 olivos todavía no se considera representativa. Por eso la herramienta calcula la madera con la edad y la densidad de cada parcela, sin medir en ella.
Qué suma, qué resta y qué queda fuera
El balance de Olive Carbon Balance reúne siete componentes. Suma el carbono que se almacena cada año en la madera del olivo y la parte del carbono de la cubierta, los restos de poda, la hoja caída y los abonos orgánicos que se queda en el suelo. Resta la respiración del suelo y las emisiones del manejo del cultivo. La madera guarda su carbono mientras el olivo siga en pie.
No todo el carbono que entra en la finca se queda en ella. De la cubierta, los restos de poda, la hoja caída o los abonos orgánicos, la herramienta cuenta solo la parte que acaba en la materia orgánica del suelo. El resto se descompone y vuelve relativamente pronto a la atmósfera como CO₂. La respiración del suelo es otra cosa: la descomposición, cada año, de la materia orgánica que el suelo ya tenía. Cuenta como una salida de carbono. La herramienta la resta. El suelo tampoco acumula carbono sin límite. Si se mantiene el mismo manejo durante años, tiende a un nuevo equilibrio. Como referencia, las guías del Grupo Intergubernamental de Expertos sobre el Cambio Climático (IPCC), de la ONU, suelen contar con unos veinte años para estimar estos cambios del carbono del suelo.
Los restos de poda suman cuando se trituran y se dejan en la parcela. El ecorrégimen de cubiertas en leñosos de la PAC también paga esta práctica. Si la leña se saca de la finca, se pierde ese carbono, y por ahora la herramienta no lo tiene en cuenta. Para la poda y la hoja caída se usan datos de la Universidad de Jaén en olivares tradicionales e intensivos. En los olivares en seto, estas estimaciones son todavía orientativas. Además, la herramienta cuenta las emisiones del combustible de todas las labores y las del nitrógeno que llega al suelo con los restos de poda, la cubierta, la hoja del olivo y los fertilizantes.
El abono orgánico interviene en los dos lados del balance: aporta carbono que puede quedar en el suelo, pero su nitrógeno también genera emisiones, en forma de óxido nitroso, igual que los fertilizantes minerales. Lo que todavía no está incorporado en la herramienta es el carbono que entra cada año con las flores y los frutos que caen al suelo y el de los exudados de la raíz. Son límites actuales de la herramienta que conviene tener presentes al interpretar el resultado.
La cuenta de Olive Carbon Balance se centra en lo que ocurre dentro de la finca, incluida la energía que consume. Las emisiones de fabricar el abono, la maquinaria o los fitosanitarios pertenecen a otra cuenta. Esa cuenta se puede hacer con normas como la ISO 14067 y abarcar todo el ciclo de vida del producto o solo algunas etapas. Por eso, el balance de la finca no sustituye a la huella de carbono de la cooperativa o de la almazara, ni es por sí solo una etiqueta ambiental del aceite.
Aun así, la fase de campo puede ser una parte importante de esa huella. Dcoop dio a conocer en septiembre de 2026 que, hasta la salida de la almazara, el 97 % de las emisiones por kilo de aceite procedían de la fase agrícola.
Dos controles que cuidan la cifra del olivo
El primero mira la edad de tu olivar y los olivos por hectárea. El modelo del olivo se ajustó con olivares de 7 a 229 años y de 76 a 408 olivos por hectárea, sin ningún seto. Si tu parcela queda fuera de ese rango, la herramienta calcula igual y avisa de que la cifra es más orientativa.
El segundo mira el resultado. A veces la cifra del olivo cae fuera de lo esperable para ese tipo de olivar: lo medido en las fincas del modelo o, en seto, lo que recogen los estudios publicados. Entonces la herramienta la enseña, pero no la suma al balance, y explica el motivo en la misma pantalla.
Además, cada modelo tiene su incertidumbre, y la herramienta da cada cifra sin margen de error. Lee el balance como una estimación, no como un número exacto.
97 muestras de suelo, 167 olivos y 16 parcelas: el trabajo detrás del cálculo
La herramienta une cuatro modelos, fórmulas que estiman un dato sin tener que medirlo en cada parcela: el del olivo, el de la cubierta, el de las emisiones y el del suelo. El de emisiones pasa el gasóleo, la luz y el abono a CO₂ con factores de referencia, como los del IPCC. Aquí positivo significa guardar carbono. En los inventarios oficiales de gases se anota al revés: lo que se guarda va en negativo.
El modelo del suelo, del CEBAS-CSIC, estima cuánto carbono tiene el suelo. Con la densidad aparente del terreno, también del CEBAS-CSIC, la herramienta lo pasa a toneladas por hectárea. Con la respiración del suelo, estima cuánto del carbono que ya tenía el suelo se descompone cada año.
Think Tank InnoTech ha construido la herramienta que une todo esto. Los modelos se apoyan en medidas tomadas en olivares reales:
- 97 muestras de suelo de olivares de Castro del Río (Córdoba), Valdepeñas (Ciudad Real) y Lora del Río (Sevilla).
- 167 olivos medidos en 39 fincas de Jaén y Córdoba, con edades desde unos pocos años hasta más de dos siglos.
- Años de medidas de cuánta hierba produce la cubierta en olivares del sur de España, entre ellos fincas del proyecto.
- El gasto real de gasóleo, luz del riego y abono de 16 parcelas durante dos años, recogido parcela a parcela.
- El carbono de los restos de poda en olivares de 67 a 285 olivos por hectárea.
- Hoja caída recogida en cajas bajo los olivos en cuatro fincas, dos tradicionales y dos intensivas.
Qué parte del carbono de la hierba se queda en el suelo sale de coeficientes de estudios publicados, revisados con el IAS-CSIC.
Quién ha desarrollado cada parte y quién tomó las medidas:
| Qué aporta | Quién lo ha desarrollado |
|---|---|
| Carbono y respiración del suelo | CEBAS-CSIC: Dr. Felipe Bastida, Dr. José Luis Moreno y María Patiño-García, con la Universidad de Jaén en la respiración del suelo |
| Cubierta vegetal | IAS-CSIC: Dr. José Alfonso Gómez y Dra. Milagros Torrús-Castillo, con la Dra. María Auxiliadora Soriano (Universidad de Córdoba) |
| Madera del olivo | Dr. Roberto García (Instituto Universitario de Investigación en Olivar y Aceites de Oliva, Universidad de Jaén), con el equipo técnico de AEMO |
| Restos de poda, hoja caída y abono orgánico | Dr. Roberto García (Universidad de Jaén) |
| Emisiones | Dr. Roberto García (Universidad de Jaén), con José María Penco y Francisco Alcántara (AEMO), que recogieron los datos de consumo parcela a parcela |
| Medida automática de la cubierta vegetal y del volumen de masa foliar de los olivos (en desarrollo) | CAR-CSIC: Dra. Roemi Fernández, Dr. Pablo González, Dr. Luis Emmi y Dr. Eduardo Navas |
| La herramienta que los une | Think Tank InnoTech: diseño y desarrollo de la herramienta |
Automatizar las medidas en el olivar
Además de los modelos que utiliza actualmente la herramienta, el proyecto trabaja en automatizar algunas de las medidas de la vegetación del olivar. En el CAR-CSIC, la Dra. Roemi Fernández, el Dr. Pablo González, el Dr. Luis Emmi y el Dr. Eduardo Navas trabajan en el desarrollo de métodos de visión artificial y sistemas de sensores para estimar de forma automática tanto la cubierta vegetal del suelo como el volumen de masa foliar de los olivos. El objetivo es obtener esta información a partir de imágenes y datos captados en las fincas y estudiar hasta qué punto estas técnicas pueden facilitar las mediciones de campo y contribuir en el futuro al cálculo del balance de carbono.

Del balance al crédito de carbono: qué aporta y qué falta
Quizá te han hablado de créditos de carbono. Para certificar carbono, primero hay que calcularlo, y Olive Carbon Balance ya calcula el balance de cada parcela. Es un cálculo para conocer la finca, no una metodología de certificación. Un crédito pide además otras cosas, entre ellas estimar, al firmar el crédito, cuánto carbono se espera almacenar en los años futuros.
En la Unión Europea hay un marco voluntario para certificar carbono, el Reglamento (UE) 2024/3012. Pide cinco cosas. Comparar con lo habitual en fincas parecidas. Que el cambio vaya más allá de lo que exige la ley y que sin el dinero de la certificación no salga a cuenta. Mantener la práctica al menos cinco años. No dañar el medio ambiente y ayudar a la biodiversidad. Y pasar una verificación independiente. Sus métodos para el carbono del campo todavía no están en vigor.
La madera de un olivar que ya existía guarda carbono igual, pero no suele admitirse para créditos, porque no se debe a un cambio en la forma de cultivar. La parte que más depende de ti es la segunda cifra.
Además, una línea del proyecto registrará los datos en una cadena de bloques (blockchain), un registro digital que no se puede borrar ni cambiar sin dejar rastro. Registrar un dato no es certificarlo, pero deja constancia de dónde sale cada cifra.
Un aviso para cooperativas y almazaras. Una directiva europea contra el lavado verde obliga a los países a prohibir dos tipos de anuncio desde el 27 de septiembre de 2026. Uno presenta un aceite como neutro en carbono, o con impacto reducido o positivo para el clima, si eso se apoya en compensar emisiones. El otro presenta como mejora de todo el aceite algo que solo mejora el campo. Este balance sirve para conocer el campo, no para ese tipo de anuncios.
Lo que este balance da ya es una foto de cada parcela: qué guarda, qué emite y qué parte depende de tu manejo.
Lo siguiente: una herramienta para decidir cambios
El proyecto prepara otra herramienta que trabajará con la segunda cifra. Te propondrá opciones y te enseñará cuánto se movería tu balance con cada una. Tú decides cuáles encajan en tu finca.
Quién está detrás de Olive Carbon Balance
Ecovalia representa al Grupo Operativo Olive Carbon Balance y es uno de sus miembros. Lo forman también AEMO, la cooperativa COLIVAL, Luque Ecológico, IngeOliva y el CSIC. El CSIC participa con tres centros: el CEBAS, el IAS y el CAR, que es un centro mixto del CSIC y la Universidad Politécnica de Madrid.
La Universidad de Jaén colabora con AEMO en los modelos del olivo y de las emisiones, aporta las medidas de la poda y de la hoja caída y calcula con el CEBAS-CSIC la respiración del suelo y su contenido de carbono orgánico. Por su parte, el CAR-CSIC desarrolla la línea de automatización de las medidas de vegetación, tanto de la cubierta vegetal como del volumen de masa foliar de los olivos, mediante técnicas de visión artificial y sensorización. Think Tank InnoTech desarrolla las dos herramientas de cálculo del proyecto.
Tu olivar lleva años guardando carbono en la madera de cada olivo, y su suelo lo gana o lo pierde según cómo se cultiva. Ahora ese carbono empieza a tener cifra propia, parcela a parcela. El balance te da la visión de conjunto. La segunda cifra te dice qué parte puedes mover tú. Si quieres saber más o colaborar, puedes escribir a Ecovalia desde esta web.
Redactado por Pedro Hernández (Think Tank InnoTech), con aportaciones del Dr. Roberto García (Universidad de Jaén), del Dr. Felipe Bastida (CEBAS-CSIC), del Dr. José Alfonso Gómez (IAS-CSIC) y de la Dra. Roemi Fernández (CAR-CSIC)
Olive Carbon Balance es un grupo operativo supraautonómico de la Asociación Europea para la Innovación en materia de productividad y sostenibilidad agrícolas (AEI-Agri). Está cofinanciado por la Unión Europea, a través del Fondo Europeo Agrícola de Desarrollo Rural (FEADER), y por el Ministerio de Agricultura, Pesca y Alimentación (MAPA), en el marco del Plan Estratégico de la PAC 2023-2027 de España (convocatoria 2023, intervención 7161). Subvención concedida: 599 991,90 €, un 80 % del FEADER y un 20 % del MAPA.
Olive grove carbon balance: what each plot sequesters and what it emits
Your olive grove sequesters carbon, and it also emits CO₂. On most of the pilot plots, the olive grove stores more than it emits. The Olive Carbon Balance Operational Group, coordinated by Ecovalia, now calculates this balance on its pilot farms, plot by plot. It also shows the part where your decisions count most.
Two numbers for each plot: what your olive grove stores and what it emits
Think of your olive grove. Every year it builds up carbon in two places: in the tree and, perhaps, in the soil too. Each olive tree builds up carbon in its wood, year after year, and that is guaranteed. The cover crop adds organic carbon to the soil. So do the pruning residues you leave chopped on your farm, the olive leaves that fall under the tree, root exudates and the organic fertilizer you spread, such as manure. But each year the soil also loses part of the organic carbon it holds, mainly because it breaks down and goes back into the atmosphere, and also through erosion. Whether the soil gains carbon each year is not guaranteed: it depends on how you manage it. And that management emits CO₂ into the atmosphere through diesel, through irrigation energy if it is not renewable, and through nitrogen fertilizer, mineral or organic. How much is emitted depends a great deal on management.
The Olive Carbon Balance tool puts all of this into one calculation and gives two numbers for each of the study farms, in kilograms of CO₂ per hectare per year. The first is the balance: what is stored each year in the olive wood plus the net change in soil organic carbon, minus the CO₂ emitted, mainly through the fuel and non-renewable energy you use. The second number is explained further down.
Both numbers are estimates made with real data from the Olive Carbon Balance experimental farms, processed with models. They show the carbon balance, but they should not be confused with carbon credits. The research involves the University of Jaén, through its University Institute of Research on Olive and Olive Oils (INUO), the Spanish Association of Olive Municipalities (AEMO) and three centers of the Spanish National Research Council (CSIC). They are the Institute for Sustainable Agriculture (IAS-CSIC), the Center for Soil Science and Applied Biology of the Segura (CEBAS-CSIC) and the Center for Automation and Robotics (CAR-CSIC). The tool is part of a research project: today the calculations are based on the pilot farms, with the partners’ data, but the team keeps improving the tool.

Part of the nitrogen in fertilizer goes into the air as nitrous oxide, a gas that causes hundreds of times more warming than CO₂. The tool converts it to the amount of CO₂ that would cause the same warming.
A positive balance means that more is stored than goes back into the air. It can also be negative. The calculation does not yet include everything that happens on the farm: you will see below what is missing.
Grass, pruning, diesel and fertilizer: where your decisions count most
Next to the balance, the tool always shows a second number: cover crop and pruning residues minus emissions. This is the part that depends most on the decisions you make each year: the grass you leave to grow between the rows, the pruning residues you chop and leave on the plot, and the diesel, electricity and fertilizer you use. The rainfall from September to May also has an effect. This number only combines the cover crop, pruning residues and emissions. It leaves out the olive wood, soil respiration, fallen leaves and the carbon in organic fertilizer. The nitrogen in that fertilizer does count, because it is part of emissions. So if you use manure, this number goes down, even though its carbon is added to the balance.
The wood is left out on purpose. The University of Jaén model calculates it from the age of the grove and the number of trees per hectare, without measuring the trees. It gives an average per year of life: what the tree has stored over its whole life, spread over its years. That is why it mostly reflects age and density, more than what you did this year.
As you know, irrigation, pruning and fertilization change how an olive tree grows, and separating that effect takes more years of measurements. In a mature grove that is pruned regularly, the growth in a given year can be below that average.
The second number can be negative, when emissions are greater than what the cover crop and pruning residues add. The tool shows it anyway, with the detail of each part.
Almost all the data are already in your field record book
To calculate the balance of a plot, the tool asks for the age of the grove, the number of trees per hectare and the type of grove: traditional, intensive or hedgerow. It also asks for the rainfall from September to May and the condition of the cover crop. For emissions, it asks for the liters of diesel and gasoline per hectare for all field operations and the kilograms of nitrogen you apply with the fertilizer, whether mineral or organic, such as manure or olive pomace. For irrigated groves, it asks for the kilowatt-hours per hectare used for irrigation each year, if the energy is not renewable. If you use organic fertilizer, it also asks which product and how many kilograms you apply per hectare per year, to calculate the carbon it leaves in the soil. You do not need to work out the nitrogen that pruning residues, grass and olive leaves leave in the soil: it comes from the partners’ estimates.
Almost all of this is already in the records you keep: the farm record book, the farm register, the diesel and electricity bills, and the nearest weather station. If someone from the cooperative keeps your record book, you already have most of this data. Sometimes diesel and electricity are recorded for the whole farm and have to be divided per hectare.
To know how much carbon comes in with the cover crop, you only need to take a look at it. The tool asks you up to three questions, with example photos from IAS-CSIC. If you receive the EU Common Agricultural Policy (CAP) eco-scheme payment for cover crops in woody crops, this is the same cover crop you already keep, although the tool is separate from that CAP procedure.
Between 1.1 and 6.4 metric tons of CO₂: what olive wood stores on average each year
According to the first results of the Olive Carbon Balance Operational Group, published in December 2025, olive wood stores on average between 1.1 and 6.4 metric tons of CO₂ per hectare per year of the tree’s life, depending on the type of grove. These are provisional values, measured by the University of Jaén and AEMO on the pilot plots, and they vary a lot from plot to plot.
Traditional groves in the Olive Carbon Balance farm network store on average 1.2 metric tons of CO₂, almost the same as intensive groves, 1.1. Hedgerow groves in the network with 800 to 1,200 trees per hectare store on average 6.4 metric tons a year, and those with more than 1,200 trees, 2.2.

Each average comes from only three to five plots, and the one for hedgerows with more than 1,200 trees is not yet considered representative. That is why the tool calculates the wood from the age and density of each plot, without measuring it.
What is added, what is subtracted and what is left out
The Olive Carbon Balance calculation brings together seven components. It adds the carbon stored each year in the olive wood and the share of the carbon from the cover crop, the pruning residues, the fallen leaves and organic fertilizers that stays in the soil. It subtracts soil respiration and emissions from crop management. The wood keeps its carbon as long as the tree is standing.
Not all the carbon that comes into the farm stays there. From the cover crop, the pruning residues, the fallen leaves or organic fertilizers, the tool counts only the part that ends up in soil organic matter. The rest breaks down and goes back into the atmosphere fairly soon as CO₂. Soil respiration is something else: the yearly breakdown of the organic matter the soil already had. It counts as carbon going out. The tool subtracts it. Soil cannot build up carbon forever either. If the same practice is kept for years, it moves toward a new equilibrium. As a reference, guidelines from the UN Intergovernmental Panel on Climate Change (IPCC) usually use a period of about 20 years to estimate these changes in soil carbon.
Pruning residues add to the balance when they are chopped and left on the plot. The CAP eco-scheme for cover in woody crops also pays for this practice. If firewood is taken off the farm, that carbon is lost, and for now the tool does not account for it. For pruning and fallen leaves, the tool uses data from the University of Jaén in traditional and intensive groves. In hedgerow groves, these estimates are still approximate. The tool also counts emissions from the fuel used in all field operations and from the nitrogen that reaches the soil with pruning residues, the cover crop, olive leaves and fertilizers.
Organic fertilizer works on both sides of the balance: it adds carbon that can stay in the soil, but its nitrogen also causes emissions, in the form of nitrous oxide, just like mineral fertilizers. What the tool does not yet include is the carbon that comes in each year with fallen flowers and fruit, or from root exudates. These are current limits of the tool to keep in mind when reading the result.
The calculation focuses on what happens within the farm, including the energy the farm uses. The emissions from making fertilizer, machinery or plant protection products belong to another calculation. That calculation can follow standards such as ISO 14067 and cover the whole life cycle of the product or only some stages. So the farm’s carbon balance does not replace the carbon footprint of the cooperative or the olive mill, and it is not an environmental label for the oil on its own.
Even so, the farming stage can account for a large share of that footprint. In September 2026, Dcoop announced that, up to the mill gate, 97% of the emissions per kilogram of oil came from the farming stage.
Two checks that protect the olive wood value
The first one looks at the age of your grove and the number of trees per hectare. The olive tree model was fitted with groves from 7 to 229 years old and with 76 to 408 trees per hectare, with no hedgerows. If your plot falls outside that range, the tool still calculates the value and warns that the value is more approximate.
The second one looks at the result. Sometimes the olive wood value falls outside the expected range for that type of grove: what was measured on the model’s farms or, for hedgerows, what published studies report. Then the tool shows it but does not add it to the balance, and it explains why on the same screen.
Also, each model has its own uncertainty, and the tool gives each number without a margin of error. Read the balance as an estimate, not an exact number.
97 soil samples, 167 olive trees and 16 plots: the work behind the calculation
The tool brings together four models, formulas that estimate a value without measuring it on every plot: one for the olive trees, one for the cover crop, one for the emissions and one for the soil. The emissions model converts diesel, electricity and fertilizer to CO₂ with reference factors, such as those from the IPCC. Here, positive means storing carbon. Official greenhouse gas inventories use the opposite sign: what is stored is recorded as negative.
The soil model, from CEBAS-CSIC, estimates how much carbon the soil holds. With the soil bulk density, also from CEBAS-CSIC, the tool converts it to metric tons per hectare. With soil respiration, it estimates how much of the carbon the soil already had breaks down each year.
Think Tank InnoTech built the tool that brings all of this together. The models are based on measurements taken in real olive groves:
- 97 soil samples from olive groves in Castro del Río (Córdoba), Valdepeñas (Ciudad Real) and Lora del Río (Seville).
- 167 olive trees measured on 39 farms in Jaén and Córdoba, with ages from a few years to more than two centuries.
- Years of measurements of how much grass the cover crop produces in olive groves in southern Spain, including project farms.
- Real diesel, irrigation electricity and fertilizer use on 16 plots over two years, recorded plot by plot.
- The carbon in pruning residues in olive groves with 67 to 285 trees per hectare.
- Fallen leaves collected in boxes under the trees on four farms, two traditional and two intensive.
How much of the grass carbon stays in the soil comes from coefficients from published studies, reviewed with IAS-CSIC.
Who developed each part and who took the measurements:
| What it contributes | Who developed it |
|---|---|
| Soil carbon and soil respiration | CEBAS-CSIC: Dr. Felipe Bastida, Dr. José Luis Moreno and María Patiño-García, with the University of Jaén for soil respiration |
| Cover crop | IAS-CSIC: Dr. José Alfonso Gómez and Dr. Milagros Torrús-Castillo, with Dr. María Auxiliadora Soriano (University of Córdoba) |
| Olive wood | Dr. Roberto García (University Institute of Research on Olive and Olive Oils, University of Jaén), with the AEMO technical team |
| Pruning residues, fallen leaves and organic fertilizer | Dr. Roberto García (University of Jaén) |
| Emissions | Dr. Roberto García (University of Jaén), with José María Penco and Francisco Alcántara (AEMO), who recorded the consumption data plot by plot |
| Automatic measurement of the cover crop and of the olive trees’ foliage volume (in development) | CAR-CSIC: Dr. Roemi Fernández, Dr. Pablo González, Dr. Luis Emmi and Dr. Eduardo Navas |
| The tool that brings them together | Think Tank InnoTech: design and development of the tool |
Automating measurements in the olive grove
Besides the models the tool uses today, the project is working to automate some measurements of the vegetation in the olive grove. At CAR-CSIC, Dr. Roemi Fernández, Dr. Pablo González, Dr. Luis Emmi and Dr. Eduardo Navas are developing computer vision methods and sensor systems to estimate automatically both the ground cover and the foliage volume of the olive trees. The goal is to get this information from images and data collected on the farms, and to study how far these techniques can make field measurements easier and help calculate the carbon balance in the future.
From the balance to carbon credits: what it brings and what is missing
You may have heard about carbon credits. To certify carbon, you first have to calculate it, and Olive Carbon Balance already calculates the balance of each plot. It is a calculation to understand the farm, not a certification methodology. A credit also needs other things, including estimating, when the credit agreement is signed, how much carbon is expected to be stored in future years.
In the European Union there is a voluntary framework to certify carbon, Regulation (EU) 2024/3012. It asks for five things. A comparison with what is usual on similar farms. A change that goes beyond what the law demands and would not pay off without the certification money. Keeping the practice for at least five years. Doing no harm to the environment and helping biodiversity. And independent verification. Its methods for farm carbon are not yet in force.
The wood of an olive grove that already existed stores carbon just the same, but it is not usually accepted for credits, because it does not come from a change in farming practice. The part that depends most on you is the second number.
Also, one of the project’s work areas will record the data on a blockchain, a digital record that cannot be deleted or changed without leaving a trace. Recording a value is not certifying it, but it keeps a record of where each number comes from.
A note for cooperatives and olive mills. An EU directive against greenwashing requires member states to ban two kinds of claim from September 27, 2026. One presents an olive oil as carbon neutral, or as having a reduced or positive climate impact, when this is based on offsetting emissions. The other presents an improvement that only concerns the farm as if it applied to the whole oil. This balance is for understanding the farm, not for claims like these.
What this balance already gives you is a snapshot of each plot: what it stores, what it emits, and which part depends on your management.
Next: a tool to help decide on changes
The project is preparing another tool that will work with the second number. It will suggest options and show you how much your balance would change with each one. You decide which ones fit your farm.
Who is behind Olive Carbon Balance
Ecovalia represents the Olive Carbon Balance Operational Group and is one of its members. The other members are AEMO, the COLIVAL cooperative, Luque Ecológico, IngeOliva and CSIC. CSIC takes part through three centers: CEBAS, IAS and CAR, a joint center of CSIC and the Technical University of Madrid.
The University of Jaén works with AEMO on the olive tree and emissions models, provides the pruning and fallen-leaf measurements, and calculates soil respiration and soil organic carbon content with CEBAS-CSIC. CAR-CSIC, for its part, is developing the automation of vegetation measurements, for both the cover crop and the foliage volume of the olive trees, using computer vision and sensors. Think Tank InnoTech develops the project’s two calculation tools.
Your olive grove has been storing carbon for years in the wood of each tree, and its soil gains or loses carbon depending on how it is farmed. Now that carbon is starting to have its own number, plot by plot. The balance gives you the overall picture. The second number tells you which part you can change yourself. If you want to know more or take part, you can contact Ecovalia through this website.
Written by Pedro Hernández (Think Tank InnoTech), with contributions from Dr. Roberto García (University of Jaén), Dr. Felipe Bastida (CEBAS-CSIC), Dr. José Alfonso Gómez (IAS-CSIC) and Dr. Roemi Fernández (CAR-CSIC)
Olive Carbon Balance is a supra-regional operational group of the European Innovation Partnership for Agricultural Productivity and Sustainability (EIP-AGRI). It is co-funded by the European Union, through the European Agricultural Fund for Rural Development (EAFRD/FEADER), and by the Spanish Ministry of Agriculture, Fisheries and Food (MAPA), within Spain’s CAP Strategic Plan 2023-2027 (2023 call, intervention 7161). Grant awarded: €599,991.90, 80% from EAFRD and 20% from MAPA.